
The Yearly Report shows total activity on your site for each calendar year.
Remember that each page hit can result in several server requests as the images
for each page are loaded.
Note: Most likely, the first and last years
will not represent a complete year's worth of data, resulting in lower hits.
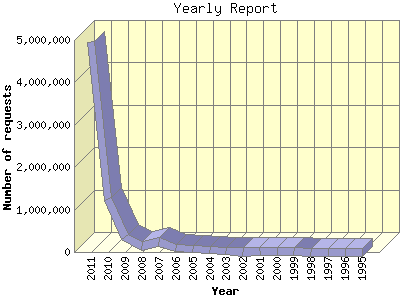
| Year | Number of requests | Number of page requests | |
|---|---|---|---|
| 1. | 2011 | 4,950,663 | 4,579,659 |
| 2. | 2010 | 1,242,028 | 1,141,875 |
| 3. | 2009 | 347,051 | 316,869 |
| 4. | 2008 | 147,178 | 131,391 |
| 5. | 2007 | 238,614 | 210,555 |
| 6. | 2006 | 100,523 | 65,769 |
| 7. | 2005 | 59,279 | 40,133 |
| 8. | 2004 | 50,893 | 31,289 |
| 9. | 2003 | 19,334 | 13,947 |
| 10. | 2002 | 8,748 | 8,066 |
| 11. | 2001 | 23,364 | 22,210 |
| 12. | 2000 | 30,327 | 30,327 |
| 13. | 1999 | 21,549 | 21,549 |
| 14. | 1998 | 10,119 | 10,119 |
| 15. | 1997 | 5,808 | 5,808 |
| 16. | 1996 | 3,632 | 3,631 |
| 17. | 1995 | 1,336 | 1,336 |
Most active year 2011 : 4,579,659 pages sent. 4,950,663 requests handled.
Yearly average: 390,266 pages sent. 427,085 requests handled.
This report was generated on January 8, 2014 11:00.
Report time frame January 11, 1995 19:26 to September 30, 2011 23:58.
| Web statistics report produced by: | |
 Analog 6.0 Analog 6.0 |  Report Magic 2.21 Report Magic 2.21 |