
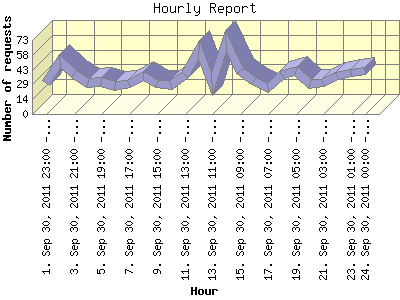
The Hourly Report identifies the level of activity for each hour within the report timeframe. Remember that one page hit can result in several server requests as the images for each page are loaded.
| Hour | Number of requests | Number of page requests | |
|---|---|---|---|
| 1. | Sep 30, 2011 23:00 - 23:59 | 31 | 29 |
| 2. | Sep 30, 2011 22:00 - 22:59 | 52 | 52 |
| 3. | Sep 30, 2011 21:00 - 21:59 | 39 | 35 |
| 4. | Sep 30, 2011 20:00 - 20:59 | 31 | 30 |
| 5. | Sep 30, 2011 19:00 - 19:59 | 32 | 30 |
| 6. | Sep 30, 2011 18:00 - 18:59 | 28 | 26 |
| 7. | Sep 30, 2011 17:00 - 17:59 | 30 | 30 |
| 8. | Sep 30, 2011 16:00 - 16:59 | 37 | 32 |
| 9. | Sep 30, 2011 15:00 - 15:59 | 30 | 27 |
| 10. | Sep 30, 2011 14:00 - 14:59 | 29 | 28 |
| 11. | Sep 30, 2011 13:00 - 13:59 | 38 | 34 |
| 12. | Sep 30, 2011 12:00 - 12:59 | 63 | 48 |
| 13. | Sep 30, 2011 11:00 - 11:59 | 30 | 21 |
| 14. | Sep 30, 2011 10:00 - 10:59 | 72 | 41 |
| 15. | Sep 30, 2011 09:00 - 09:59 | 42 | 40 |
| 16. | Sep 30, 2011 08:00 - 08:59 | 33 | 30 |
| 17. | Sep 30, 2011 07:00 - 07:59 | 26 | 24 |
| 18. | Sep 30, 2011 06:00 - 06:59 | 38 | 35 |
| 19. | Sep 30, 2011 05:00 - 05:59 | 42 | 33 |
| 20. | Sep 30, 2011 04:00 - 04:59 | 30 | 30 |
| 21. | Sep 30, 2011 03:00 - 03:59 | 31 | 29 |
| 22. | Sep 30, 2011 02:00 - 02:59 | 37 | 35 |
| 23. | Sep 30, 2011 01:00 - 01:59 | 40 | 37 |
| 24. | Sep 30, 2011 00:00 - 00:59 | 42 | 41 |
Most active hour Feb 14, 2009 02:00 - 02:59 : 21,293 pages sent. 72 requests handled.
Hourly average: 33 pages sent. 37 requests handled.
This report was generated on January 8, 2014 11:00.
Report time frame January 11, 1995 19:26 to September 30, 2011 23:58.
| Web statistics report produced by: | |
 Analog 6.0 Analog 6.0 |  Report Magic 2.21 Report Magic 2.21 |